(A) Firm and Industry: A competitive market
is made up of a large number of firms with complete freedom of entry.
Such firms together are called competitive industry. An industry
can be defined as a group of firms producing homogeneous products
with freedom of entry and exit and which earn only normal profits.
Hence the concept of an industry is applicable only under competitive
conditions. There is no fixed size of an industry though the analytical
stability of an industry can be stated. An industry is said to be
stable and in equilibrium when in the long run all adjustments have
been made and there is neither tendency for outside firms to enter
nor tendency for inside firms to exit; hence each firm makes only
normal profits.
(B) Market Supply Curve: Before we analyze
the long run market equilibrium of a competitive industry let us
begin with the demand and supply curves. The market demand curve
under competitive industry conditions is downward sloping. Its supply
curve is governed by the cost structure.

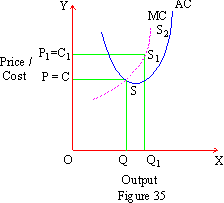
In Figure 35 we have Average and Marginal Cost curves
of a firm. Marginal Cost curve intersects Average Total Cost curve at a
minimum point. A rational profit maximizing firm is supposed to arrive
at a point such as S and produce output Q. Since for smaller output
levels Average Cost is still falling and for larger output levels
Average Cost is rising, at initial point S Average Cost C1 = Price P. At price P a firm’s supply is Q. If a firm is required to make additional supply such as Q1 it will expect to cover its additional or Marginal Cost as S1 = C1. Supply will increase only when C1 = price P1 in the market i.aspsing.
The law of supply is therefore a direct relation between price and supply. Higher the price (P1)
greater the supply. A firm’s supply curve is equiv.aspt to its
Marginal Cost curve. To construct market supply curves of a firm we
have to make a lateral summation of the supply of firms. Therefore the
market supply curve is much more flexible and flatter than the supply
curves of individual firms.
 .aspnter>
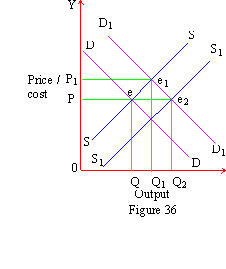
In Figure 36 we have DD and SS as industry demand and supply curves respectively. Their point of intersection is e
where equilibrium is established. This is short run equilibrium under
which Q is the qua.aspy bought and sold and P is the price charged. If
the demand condition suddenly changes then the demand curve will shift
upwards as D1D1. In the short run on the old supply curve SS a new equilibrium p.asp.asp.asp e1 is established. In this equilibrium quantity exchanged increases to Q1 and the price rises as P1.
With a rise in price the same firms start earning Super Normal
profits. Therefore outside firms are attracted and start entering the
industry. In the long run industry supply curve is shifted downwards as
S1S1. A new point of equilibrium e2 is established where D2D2 and S2S1 have intersected. In the new equilibrium position a larger quantity Q1
is exchanged at the same old price P. The firms again earn only normal
profits. The long run equilibrium price will depend upon the cost
structures of the new and old firms. The price may take any one of the
three forms in the long run. Normal possibility is that either the
price will remain constant or it will be slightly higher than that in
the short run.
 Home
Home
Tidak ada komentar:
Posting Komentar
Terima Kasih