(A) Meaning: Aggregate supply is the
total quantity supplied by the producers and sellers. In the scheduled
form it is presented through a range of expected quantities supplied at
arbitrarily chosen prices.
|
Aggregate
Supply Schedule
|
||
|
Price
|
Quantity
supplied
|
|
|
1
2
3
4
5
6
|
5
15
30
48
58
60
|
|
(B) Direct Relationship: Aggregate supply shows a direct relationship
with the changes in the price level. As price level rises (from 1
through 6) the quantity supplied goes on increasing (from 5 through 60).
The direct relationship between price and aggregate supply is due to
the same reason as in the case of individual supply curve. In both the
cases the cost of production goes on increasing with every
addition to the goods produced. Therefore more and more supply can be
made only when the price level is rising in order to cover rising cost
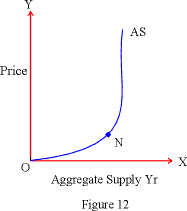
of production. It can be represented graphically in Figure 12.

In figure 12, quantity supplied has been measured
along horizontal axis and price level has been shown on the vertical
axis. Because of the direct relation between the two, the supply curve
O-AS is continuously rising upwards. However, there is an important
difference in the behavior between individual and aggregate supply
curves. An individual supply curve is moderately steep throughout. But in case of aggregate supply curve, two distinct phases are noticeable. Initially the AS curve is flatter and rises upwards only gradually. In the figure ON is such an initial phase. But later on the AS curve becomes steeper and finally becomes a vertical straight line. In the figure, N-AS is such steeper phase.
 Home
Home
Tidak ada komentar:
Posting Komentar
Terima Kasih